Uptime Monitor – Real-Time Service Status Dashboard
Purpose
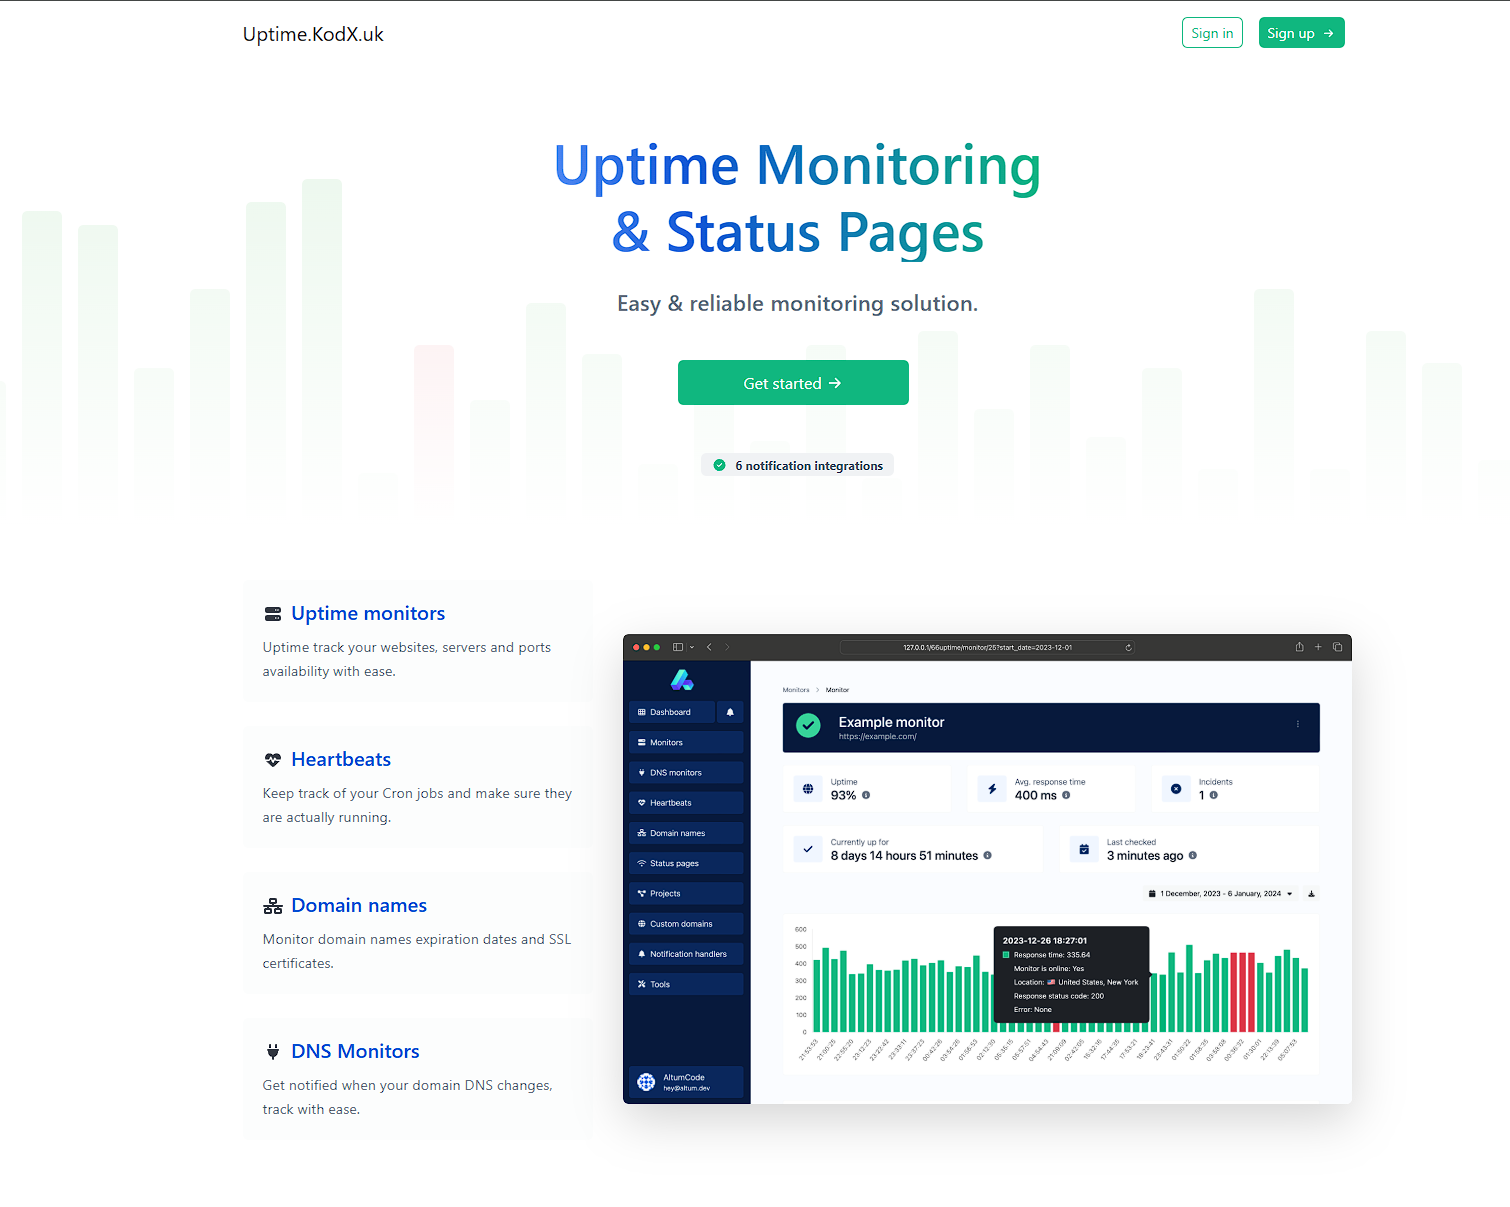
The Uptime Monitor, hosted at uptime.kodx.uk, is a dedicated web application designed to provide real-time visibility into the operational status of critical services and endpoints. Its primary purpose is to ensure system reliability by continuously monitoring the availability and response times of various web services, APIs, and infrastructure components. This tool is essential for DevOps teams, system administrators, and developers who need to quickly identify outages, performance degradation, or latency issues, enabling proactive incident response and minimizing downtime.
Functions
- Real-Time Status Monitoring: Continuously checks the health of configured endpoints (e.g., HTTP/HTTPS URLs, APIs) at regular intervals, displaying live status indicators (e.g., green for operational, red for down).
- Historical Uptime Tracking: Logs and visualizes uptime data over customizable time periods (e.g., last 24 hours, 7 days, 30 days) to assess long-term reliability and identify patterns.
- Response Time Metrics: Measures and displays average response times for each monitored service, helping to detect performance bottlenecks or latency spikes.
- Incident Alerts & Notifications: Sends automated alerts (e.g., via email, webhooks, or Slack) when a service goes down or exceeds a predefined response time threshold, ensuring rapid awareness.
- Multi-Service Dashboard: Aggregates status for multiple services in a single, centralized view, allowing users to monitor an entire infrastructure from one page.
- Public Status Page: Optionally exposes a public-facing status page to share service health with end-users or stakeholders, enhancing transparency.
Technologies
- Frontend: Built with modern JavaScript frameworks (likely React or Vue.js) for a dynamic, responsive user interface. Uses CSS frameworks (e.g., Tailwind CSS or Bootstrap) for clean, mobile-friendly styling.
- Backend: Powered by Node.js (Express) or Python (Flask/Django) to handle monitoring logic, API endpoints, and data processing. The backend orchestrates periodic health checks and stores results.
- Database: Utilizes a time-series database (e.g., InfluxDB, PostgreSQL with TimescaleDB, or SQLite) to efficiently store and query historical uptime and response time data.
- Monitoring Engine: Custom scripts or open-source tools (e.g., Uptime Kuma, Grafana, or Prometheus) integrated to perform HTTP/HTTPS requests, parse responses, and calculate metrics.
- Hosting & Infrastructure: Deployed on a cloud platform (e.g., Vercel, Netlify, or a VPS) with SSL/TLS encryption for secure data transmission. Uses environment variables for configuration.
- API Integration: RESTful APIs for fetching live status, historical data, and configuration updates. Webhook support for third-party integrations.
UI Features
- Live Status Cards: Each monitored service is displayed as a card with a color-coded indicator (green/red/yellow) and a timestamp of the last check, providing instant visual feedback.
- Interactive Timeline Charts: Users can toggle between time ranges (e.g., 24h, 7d, 30d) to view uptime history as a bar or line chart, with hover tooltips showing exact timestamps and status.
- Responsive Design: The dashboard adapts seamlessly to desktop, tablet, and mobile screens, ensuring accessibility on any device.
- Search & Filter: A search bar and filter options allow users to quickly locate specific services or view only those with issues.
- Dark/Light Mode: A toggle for theme preference, reducing eye strain and improving usability in different lighting conditions.
- Notification Preferences: A settings panel where users can configure alert channels (email, Slack, etc.) and thresholds for response time or downtime.
- Export Data: Option to download historical uptime reports in CSV or JSON format for external analysis or compliance.
×
![]()