Crypto Dashboard – Real-Time Cryptocurrency Tracker
Project Purpose
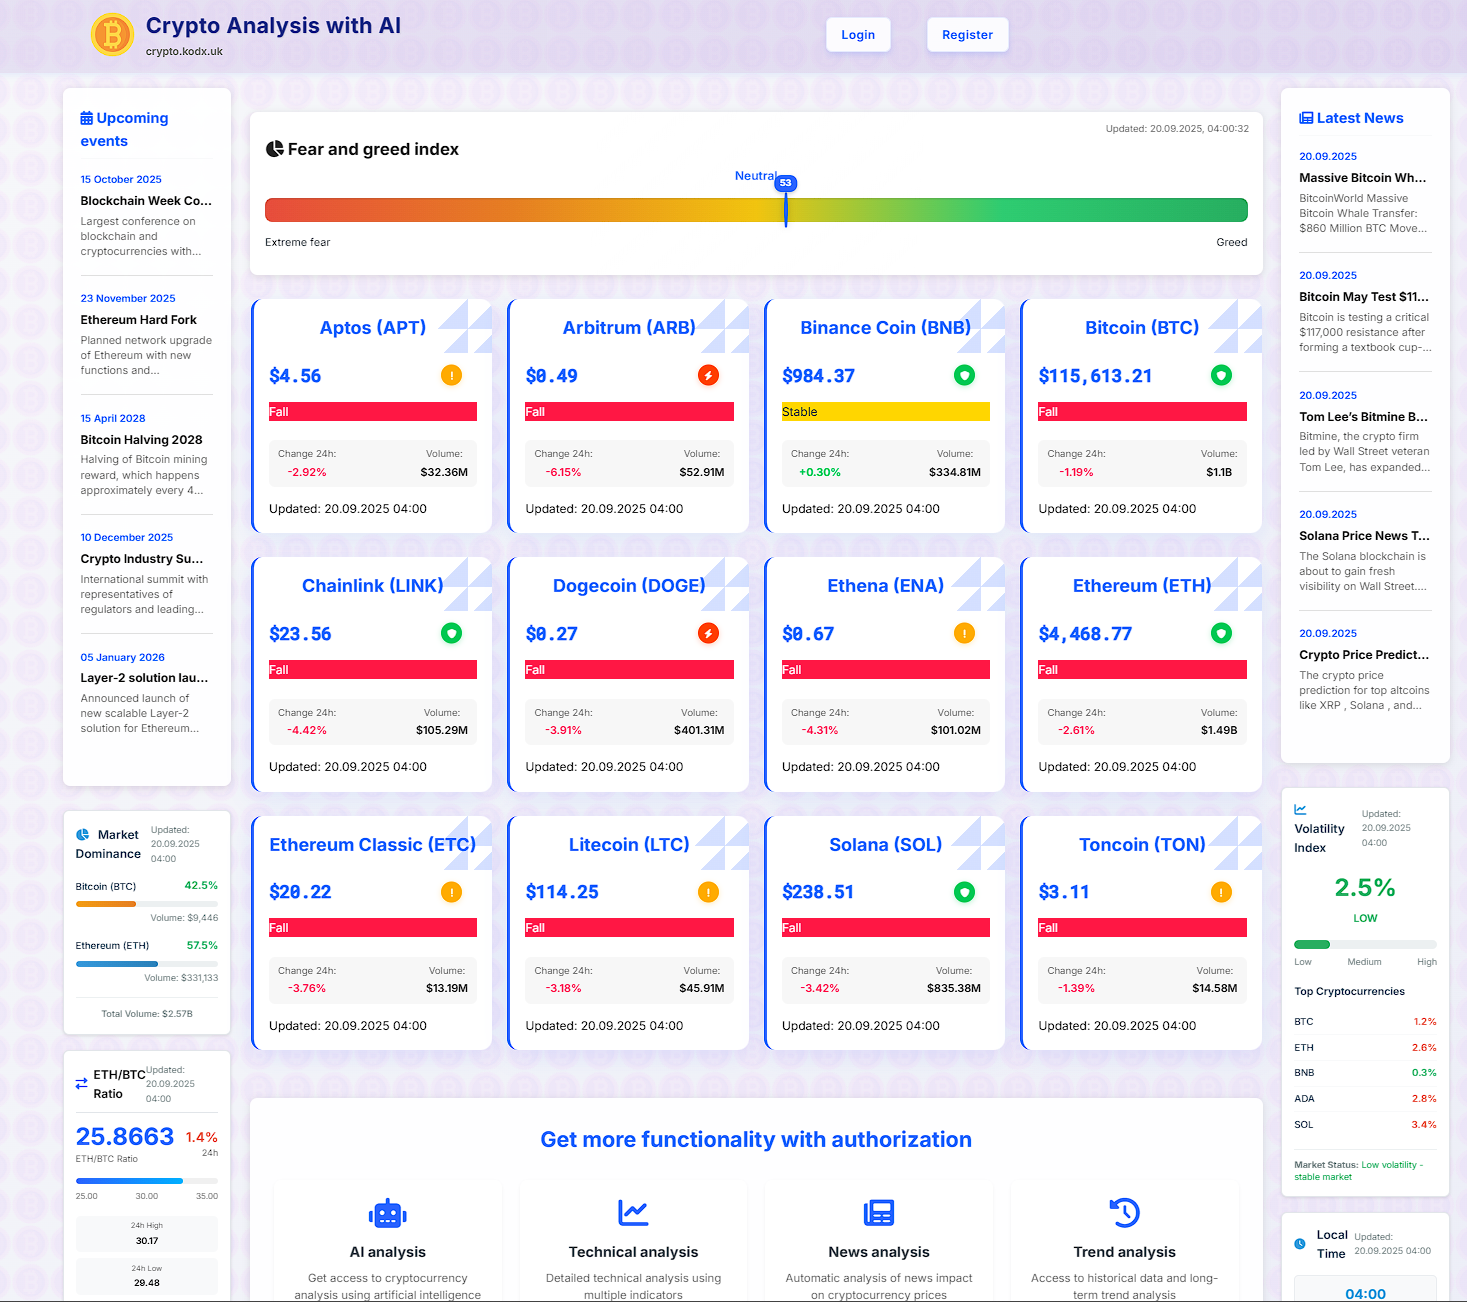
The Crypto Dashboard, hosted at crypto.kodx.uk, is a web application designed to provide users with real-time data and insights into the cryptocurrency market. Its primary purpose is to simplify the monitoring of digital assets by offering a clean, intuitive interface that displays live prices, market trends, and key metrics for a wide range of cryptocurrencies. The project aims to serve both casual investors and experienced traders who need quick access to up-to-date market information without navigating complex financial platforms.
Key Functions
- Live Price Tracking: Displays current prices for major cryptocurrencies (e.g., Bitcoin, Ethereum, Litecoin) with automatic updates via API integration.
- Market Overview: Shows 24-hour price changes, trading volume, market capitalization, and percentage gains/losses for each asset.
- Search & Filter: Allows users to search for specific cryptocurrencies or filter by market cap rank, price range, or performance metrics.
- Historical Data Visualization: Provides interactive charts (line or candlestick) for selected timeframes (1 day, 1 week, 1 month, 1 year) to analyze price trends.
- Portfolio Simulation: Enables users to create a virtual portfolio by adding assets and tracking hypothetical gains/losses based on real-time data.
- News Feed Integration: Aggregates recent cryptocurrency news from trusted sources to keep users informed about market-moving events.
Technologies Used
- Frontend: Built with React.js for a dynamic, component-based user interface. State management is handled via React Context API or Redux for efficient data flow.
- Backend: Node.js with Express.js serves as the API gateway, handling requests and caching data to reduce latency.
- Data Source: Integrates with the CoinGecko API (or similar) for real-time cryptocurrency prices, market data, and historical charts.
- Charts: Uses Chart.js or D3.js for rendering interactive, responsive price charts with zoom and tooltip features.
- Hosting & Deployment: Deployed on a cloud platform (e.g., Vercel, Netlify, or a custom VPS) with HTTPS enabled for secure data transmission.
- Styling: CSS modules or Tailwind CSS for a modern, responsive design that adapts to desktop and mobile screens.
UI Features
- Dark/Light Mode Toggle: Users can switch between themes for comfortable viewing in different lighting conditions.
- Responsive Grid Layout: Cards for each cryptocurrency adjust seamlessly from a multi-column desktop view to a single-column mobile layout.
- Live Price Ticker: A scrolling ticker at the top of the page shows real-time price changes for top coins.
- Interactive Charts: Hovering over chart points reveals precise price and date data, with zoom functionality for detailed analysis.
- Search Autocomplete: As users type in the search bar, suggestions appear with coin logos and symbols for quick selection.
- Color-Coded Indicators: Green and red highlights instantly show positive or negative price movements, with arrows indicating trends.
- Minimalist Dashboard: A clean, uncluttered interface prioritizes readability, with key metrics (price, change, volume) displayed prominently.
Overall, the Crypto Dashboard project demonstrates proficiency in full-stack web development, API integration, and user-centered design. It offers a practical tool for cryptocurrency enthusiasts while showcasing modern frontend and backend technologies in a production-ready application.